SCENARIO 14-3
is a measure of the probability that can
The tree diagram below shows the results of the classification tree model that has been constructed to predict the probability of a cable company's customers who will switch ("Yes" or "No") into its bundled program offering based on the price ($30, $40, $50, $60) and whether the customer spends more than 5 hours a day watching TV ("Yes" or "No") using the data set of 100 customers collected from a survey. 
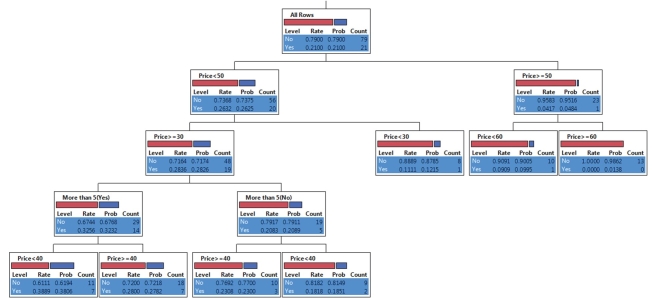
-Referring to SCENARIO 14-3, the highest probability of switching is predicted to occur among customers who do not watch more than 5 hours of TV a day and are offered the bundled price of higher than $50.
Definitions:
Q7: A coyote can alter its diet to
Q26: Scientists often depict their understanding of an
Q30: What measure(s) might consumers take to aid
Q44: Referring to SCENARIO 15-9, construct an X
Q56: The CPL and CPU indexes are used
Q138: Referring to SCENARIO 14-4, the highest mean
Q141: Referring to Scenario 12-13, the p-value of
Q188: The interpretation of the slope is different
Q202: Referring to SCENARIO 14-3, the highest probability
Q223: Referring to SCENARIO 13-10, the residual mean