Multiple Choice
Figure 8-2
The vertical distance between points C and D represents a tax in the market.
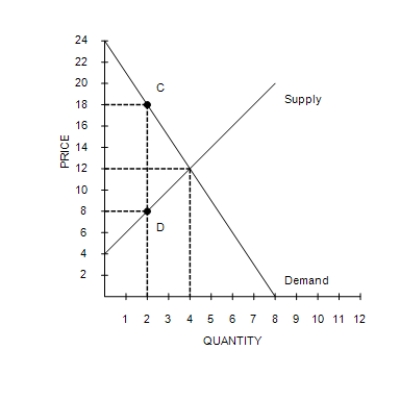
-Refer to Figure 8-2. The loss of producer surplus for those sellers of the good who continue to sell it after the tax is imposed is
Definitions:
Related Questions
Q19: Taxes drive a wedge into the market
Q24: A price ceiling is<br>A)often imposed on markets
Q62: If the size of a tax triples,
Q86: Refer to Figure 8-10. Suppose the government
Q110: The world price of a pound of
Q131: Refer to Figure 8-10. Suppose the government
Q145: Refer to Figure 10-1. This graph represents
Q192: Refer to Scenario 8-1. If Ernesto cleans
Q198: Refer to Figure 8-2. The imposition of
Q203: Refer to Figure 6-19. If the government