Multiple Choice
Find the indicated z score. The graph depicts the standard normal distribution with mean 0 and standard deviation 1. Shaded area is 0.4483. 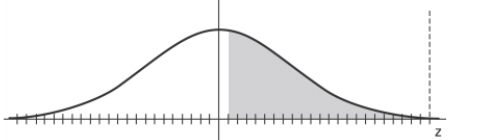
Definitions:
Related Questions
Q3: Four different judges each rank the quality
Q10: Let <span class="ql-formula" data-value="M"><span class="katex"><span
Q14: Use the given process data to
Q17: The following data show the number
Q18: <span class="ql-formula" data-value="\left[ \begin{array} { r r
Q21: Describe any similarities or differences in the
Q22: Scores on a test are normally
Q27: A simple random sample of the running
Q45: Suppose <span class="ql-formula" data-value="\left\{ \mathbf
Q50: A certain army is engaged in