Use the following technology display from a Two-Way ANOVA to answer the next
questions. Wildlife biologists studying beaver habitats measured the number
of beaver colonies per square mile identified at two randomly selected wetland
habitats, under three densities of tree growth (sparse, average, or dense growth).
Use a .05 significance level. 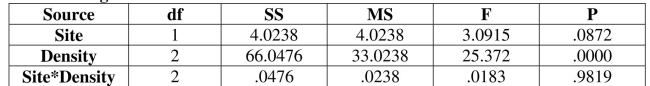
-For the density effect, state a conclusion about the null hypothesis.
Definitions:
Control Limits
Statistical boundaries set in process control charts that indicate the acceptable range of process performance and help identify moments of significant deviation or trend.
Standard Errors
Measures of the variability or spread of a sample statistic distribution if the experiment were to be repeated many times.
Control Limits
The boundaries in statistical process control that indicate the acceptable range of process variation.
Sample Mean
The average of a sample set of numbers, calculated as the sum of all the observed values divided by the number of observations.
Q3: Consider the following investment cash flow. <img
Q8: A researcher from the department of defense
Q25: Find the probability that no particles pass
Q27: Identify the P-value and level of significance.
Q36: Identify the null hypothesis and alternative hypothesis.
Q36: A sample of Medtronic's rechargeable implanted spine
Q38: Divide the real numbers, if possible. <img
Q46: To be completely accurate, a model railroad
Q280: Round to the hundreds place. 9964<br>A)9900<br>B)10,000<br>C)9960<br>D)10,100
Q318: Use a protractor to construct an angle