Solve the problem.
-The graph shows the number of organ transplants in a certain country for the years 2005 to 2010 where represents the number of years since 2005 .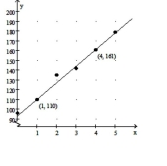
The linear model was created using the points and .
a. Interpret the meaning of the slope in the context of this problem.
b. Interpret the meaning of the -intercept in the context of this problem.
Definitions:
Q61: <span class="ql-formula" data-value="( x + 7 )
Q66: <span class="ql-formula" data-value="X = \{ x \mid
Q94: A quadratic function is a polynomial function
Q107: <span class="ql-formula" data-value="( 3 , - 3
Q149: <span class="ql-formula" data-value="6 y + 3 =
Q164: <span class="ql-formula" data-value="9 s ^ { 2
Q192: <span class="ql-formula" data-value="4 ( x + 2
Q210: As <span class="ql-formula" data-value="x \rightarrow
Q353: <span class="ql-formula" data-value="x ^ { 2 }
Q378: The cost to buy tickets online