Graph the equation. Find seven solutions in your table of values for the equation by using integers for x, starting with -3
and ending with 3.
-A census was taken to determine the median annual income for residents of a selected region of the United States, by level of education. The given polynomial models describe the median annual income for men, M, and
For women, W, who have completed x years of education. Shown in a rectangular coordinate system are the
Graphs of the polynomial models. Identify the median annual income for a man with 10 years of education as a
Point on the appropriate graph. 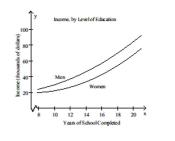
Definitions:
Experimental Studies
Research studies that manipulate conditions to examine the cause and effect relationship between variables.
Experimental Study
A research method where the investigator manipulates one or more variables to determine their effect on a dependent variable, often involving control groups.
Observational
Pertaining to data or a study method where the researcher observes subjects without manipulating any variables.
Nominal Scale
Refers to a classification system in statistics where data can be divided into non-numeric categories that are labeled or named; there is no intrinsic ordering to the categories.
Q12: Bias is the tendency for samples to
Q15: A tour group split into two groups
Q17: <span class="ql-formula" data-value="\left( 5 ^ { 6
Q24: <span class="ql-formula" data-value="( x + 9 )
Q30: River City is seeking to compare the
Q49: <img src="https://d2lvgg3v3hfg70.cloudfront.net/TB6730/.jpg" alt=" A) function B)
Q81: <span class="ql-formula" data-value="7 ( x + 5
Q89: <span class="ql-formula" data-value="9 x + 8 +
Q94: <span class="ql-formula" data-value="y=x-2"><span class="katex"><span class="katex-mathml"><math xmlns="http://www.w3.org/1998/Math/MathML"><semantics><mrow><mi>y</mi><mo>=</mo><mi>x</mi><mo>−</mo><mn>2</mn></mrow><annotation encoding="application/x-tex">y=x-2</annotation></semantics></math></span><span
Q155: There are 14 more sophomores than juniors