A study was conducted to test the effectiveness of supermarket sales strategies. At one supermarket, the price level (regular, reduced price, and at cost to supermarket) and display level (normal display space, normal display space plus end-of-aisle display, and twice the normal display space) were tested to determine if they had any effect on the weekly sales of a particular supermarket product. Each of the combinations of price level and display level were put in place for a randomly selected week and the weekly sales of the product was recorded. Each combination was used three times over the course of the experiment. The results of the study are shown here: 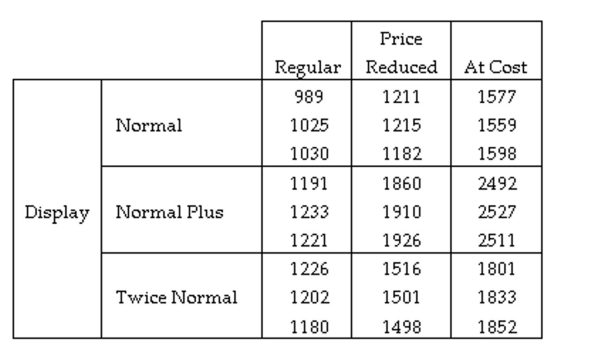
Find the test statistic for determining whether the interaction between Price and Display is significant.
Definitions:
Discrepancy
A difference or inconsistency found when comparing two or more items, figures, or documents.
Net Realizable Value
The estimated selling price in the ordinary course of business minus any costs necessary to make the sale.
Major Inventory
Major Inventory refers to the significant stock of goods a company holds for the purpose of sale or production in its normal business operations.
Valuation
The process of determining the current worth of an asset or a company, based on metrics such as earnings, sales, assets, and more.
Q13: A random sample of 250 students
Q15: <span class="ql-formula" data-value="\alpha = 0.01 , \mathrm
Q56: <span class="ql-formula" data-value="\text { Let } \chi
Q97: Assume that <span class="ql-formula" data-value="\sigma
Q117: <span class="ql-formula" data-value="\sqrt [ 3 ] {
Q143: A method currently used by doctors to
Q209: <span class="ql-formula" data-value="\frac { x ^ {
Q377: <span class="ql-formula" data-value="( p - q )
Q432: <span class="ql-formula" data-value="( 4 m + 1
Q533: <span class="ql-formula" data-value="\frac { \mathrm { m