SCENARIO 17-2 One of the most common questions of prospective house buyers pertains to the cost of heating in dollars (Y) . To provide its customers with information on that matter, a large real estate firm used the following 4 variables to predict heating costs: the daily minimum outside temperature in degrees of Fahrenheit (X1) , the amount of insulation in inches (X2) , the number of windows in the house (X3) , and the age of the furnace in years (X4) . Given below are the EXCEL outputs of two regression models.
Model 1
Regression Statistics R Square Adjusted R Square Observations 0.80800.756820 ANOVA
Regression Residual Total df41519 SS 169503.424140262.3259209765.75MS42375.862684.155F15.7874 Significance F0.0000
Intereept X1 (Temperature) X2 (Insulation) X3 (Windows) X4 (Furnace Age) Coefficients 421.4277−4.5098−14.90290.21516.3780 Standard Error 77.86140.81295.05084.86754.1026 t Stat 5.4125−5.5476−2.95050.04421.5546 P-value 0.00000.00000.00990.96530.1408 Lower 90.0% 284.9327−5.9349−23.7573−8.3181−0.8140 Upper 90.0% 557.9227−3.0847−6.04858.748413.5702
Model 2
Regression Statistics R Square Adjusted R Square Observations 0.77680.750620
ANOVA
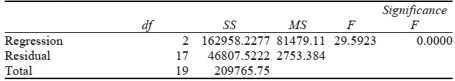
Intercept X1 (Temperature) X2 (Insulation) Coefficients 489.3227−5.1103−14.7195 Standard Error 43.98260.69514.8864t Stat 11.1253−7.3515−3.0123 P-value 0.00000.00000.0078 Lower 95% 396.5273−6.5769−25.0290 Upper 95% 582.1180−3.6437−4.4099
-Referring to Scenario 17-2, what is the value of the partial F test statistic for H0:β3=β4=0 vs. H1: At least one βj=0,j=3,4 ?
Recognize the impact of antitrust laws like the Sherman Antitrust Act and the Clayton Act on market behavior.
Analyze the role of predatory pricing and other anti-competitive practices in market dynamics.
Explore the implications of resale price maintenance on market outcomes.
Examine how cooperative behavior among competitors affects market structure and consumer welfare.
Chromosomal Defect
An abnormal condition or mutation affecting the chromosomes, leading to physical and/or mental developmental issues.
Down Syndrome
A genetic disorder caused by the presence of an extra chromosome 21, characterized by physical and intellectual developmental delays.
Hypotonic Musculature
Refers to muscles that have less than normal tone or strength, often seen in various neurological or muscular disorders.
Physical Characteristics
The tangible attributes or features of an object or organism, including size, shape, color, and structure.