SCENARIO 17-15
The tree diagram below shows the results of the classification tree model that has been constructed to
predict the probability of a cable company's customers who will switch ("Yes" or "No") into its
bundled program offering based on the price ($30, $40, $50, $60) and whether the customer spends
more than 5 hours a day watching TV ("Yes" or "No") using the data set of 100 customers collected
from a survey. 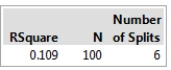
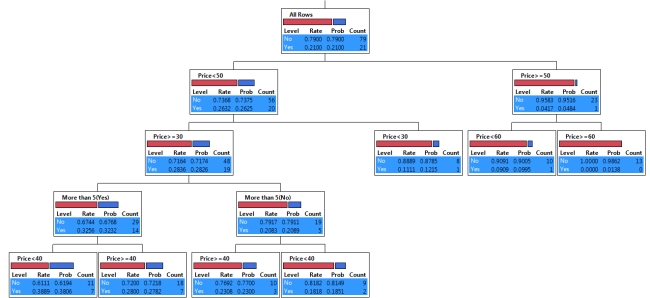
-Referring to Scenario 17-15, what is the highest rate of switching into the bundled offering?
Definitions:
Q37: Referring to Scenario 16-15-A, if a five-year
Q58: Referring to Scenario 18-10, the c chart
Q66: Dashboards may contain all but which of
Q84: Referring to Scenario 16-4, a centered 5-year
Q85: One of the morals of the red
Q86: When an additional explanatory variable is introduced
Q118: Consider a regression in which
Q172: Referring to Scenario 14-2, for these data,
Q176: Referring to Scenario 16-13, what is
Q315: Referring to Scenario 14-1, for these data,