SCENARIO 14-17
Given below are results from the regression analysis where the dependent variable is the number of
weeks a worker is unemployed due to a layoff (Unemploy) and the independent variables are the age
of the worker (Age) and a dummy variable for management position (Manager: 1 = yes, 0 = no).
The results of the regression analysis are given below:
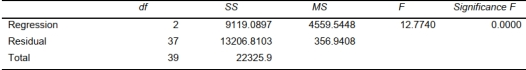
-Referring to Scenario 14-17, the null hypothesis implies that the number of
weeks a worker is unemployed due to a layoff is not affected by some of the explanatory
variables.
Definitions:
Geertz's
Referring to the work or theoretical contributions of Clifford Geertz, an American anthropologist known for his interpretative approach to culture.
Webs of Significance
A concept in cultural anthropology that signifies the intricate and interconnected symbols and meanings in a society.
Cultures
The shared beliefs, values, norms, and practices that characterize a group of people and guide their understanding and interaction with the world.
Cultural Approach
A methodology in anthropology and sociology focused on understanding how cultures influence individuals' perspectives and behaviors.
Q3: Referring to Scenario 13-9, the degrees of
Q28: Referring to Scenario 13-4, the error or
Q36: Referring to Scenario 13-4, the managers of
Q79: Referring to Scenario 15-7-A, there is sufficient
Q116: Referring to Scenario 12-1, what is
Q156: Referring to Scenario 13-13, the decision on
Q172: Referring to Scenario 16-13, the best model
Q209: Referring to Scenario 14-8, the analyst
Q238: The Chancellor of a university has commissioned
Q381: Referring to Scenario 14-20-A, what is the