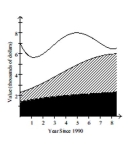
The stacked line chart shows the value of each of Danny's investments. The stacked line chart contains three regions. The uppermost unshaded region represents the value of Danny's investment in individual stocks. The center shaded region represents the value of Danny's investment in mutual funds and the bottom region in black represents the value of Danny's investment in a CD. The thickness of a region at a particular time tells you its value at that time.  Use the graph to answer the question.
-In which year was the value of Danny's investment in individual stocks the least?
Definitions:
Expectations
Beliefs or anticipations about the way events, behaviors, or things should be in the future.
Theoretical Diversity
The presence and acceptance of a variety of theories or viewpoints in any field of study, acknowledging that multiple perspectives can contribute to a comprehensive understanding of a topic.
Nature And Nurture
The debate regarding the relative importance of an individual's innate qualities (nature) versus personal experiences (nurture) in determining or causing differences in physical and behavioral traits.
Heredity
The genetic transfer of characteristics, whether physical or mental, from one generation to the next.
Q29: A final exam in Math 160 has
Q30: In which year was the value of
Q49: A study conducted at a certain college
Q56: The numbers listed below represent the
Q76: A contractor is considering a sale that
Q84: Which of the following statements is correct?<br>A)An
Q94: The speed of a new microprocessor is
Q105: The color of your house<br>A)Quantitative because it
Q107: Automobile battery ratings: "good", "better", "best"
Q108: The following frequency table shows the