Answer the question.
-The graph below shows the approximate annual percentage growth rate in world
population for the years 1960 through 2010. Data is estimated by the UN Census Bureau. 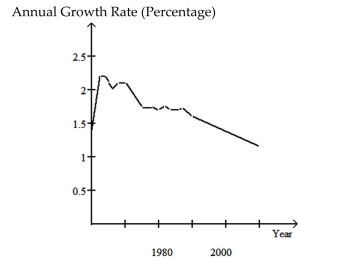 Why must the graph be interpreted with care? If the graph is not interpreted with care
what misleading impression might one have of world population during the period
1960-2010? In which year during the period 1960-2010 is estimated world population the
greatest? During which years did world population increase at the fastest rate?
Summarize the overall trends in world population during the period 1960-2010.
Definitions:
Medium of Exchange
An item that is widely accepted in transactions for goods and services because it simplifies trade and eliminates the need for a coincidental wants barter system.
Capital Good
Long-term assets used in the production of goods and services, such as machinery, buildings, and equipment.
Store of Value
Store of value is a function of money that allows it to retain purchasing power over time, enabling people to save it and use it in the future.
Fundamental Questions
Basic economic queries that address what to produce, how to produce, and for whom to produce, guiding resource allocation.
Q59: You are the coach of a basketball
Q77: Matt is single and earned wages of
Q87: A couple over the age of 65
Q91: Test score and height for adults<br>A)No correlation<br>B)Weak
Q98: A researcher from an environmental group wishes
Q157: In Angela's class, the taller students got
Q192: How much profit per share did
Q199: In a game, you have a 1/43
Q257: Between 1990 and 2000, the population of
Q278: <span class="ql-formula" data-value="\$ 953"><span class="katex"><span class="katex-mathml"><math xmlns="http://www.w3.org/1998/Math/MathML"><semantics><mrow><mi