SCENARIO 17-4
The regression tree below was obtained for predicting the weekend box office revenue of a newly
released movie (in thousands of dollars)based on data collected in different cities on the expenditure
(at $25, $30, $35, $40, $45, $50, $55, $60, $65 or $70 thousand)spent on TV advertising and the
number of times (10, 15, 20, 25, 30 or 35)a day the advertisement appear on TV.
Business Analytics 17-15 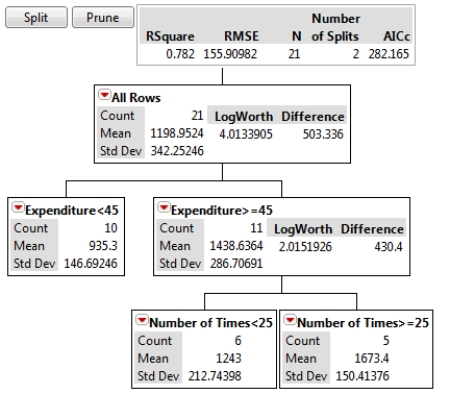
-True or False: Referring to Scenario 17-4, the first split occurs at 25 TV appearances a day of
the advertisement.
Definitions:
Cell A3
A reference to a specific cell in a spreadsheet located at the intersection of column A and row 3, commonly used to input or reference data.
Trendline
A graphical representation showing the main direction or trend of data over a period of time, often used in charts to analyze patterns.
Trendlines
Graphical representations in data analysis that show the general direction or trend of data points over a period of time.
Formula Auditing Group
A collection of tools in spreadsheet applications that assist users in examining and troubleshooting the formulas in a worksheet.
Q1: True or False: Referring to Scenario 19-8,
Q20: True or False: Total Production Maintenance is
Q29: Referring to Scenario 20-5, what is the
Q31: True or False: Referring to Scenario 17-4,
Q56: True or False: The LogWorth statistic is
Q56: Several watch-dog consumer groups have criticized the
Q66: Blossom's Flowers purchases roses for sale for
Q72: Referring to Scenario 13-3, the director of
Q80: Referring to Scenario 13-9, the estimated change
Q95: Referring to Scenario 18-6, what is the