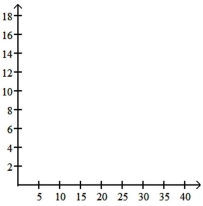
The data shows the roundtrip mileage that 43 randomly selected students drive to school each day. Construct a frequency polygon. Applying a loose interpretation of the requirements for a normal distribution, do the mileages appear to be normally distributed? Why or why not? 
Definitions:
Per-Unit Subsidy
A financial incentive given by the government, reducing the cost of each unit of a good or service to either the producer or consumer.
Profit Maximization
A business objective to achieve the highest possible profit from operations, often by adjusting production, prices, and other variables.
Competitive Industry
An industry structure where many firms compete for market share, with no single company dominating the market.
Demand Curve
A graphical representation showing the relationship between the price of a good and the quantity of that good that consumers are willing to buy.
Q6: Compute a 95% confidence interval for the
Q8: Sturges' guideline suggests that when constructing
Q34: On a multiple choice test with 26
Q35: Packing Line A packing company investigates
Q54: Which is true about a 95% confidence
Q69: Salaries of college professors.<br>A) Nominal<br>B) Ordinal<br>C) Interval<br>D)
Q86: We have calculated a confidence interval
Q107: A coffee house owner knows that
Q111: <span class="ql-formula" data-value="n = 2515 ; p
Q133: <span class="ql-formula" data-value="\begin{array}{c|c}\mathrm{x} & \mathrm{P}(\mathrm{x}) \\\hline 0