Here are data about the average January low temperature in cities in the United States, and factors that might allow us to
predict temperature. The data, available for 55 cities, include: 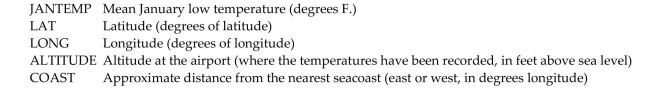 We will attempt to make a regression model to help account for mean January temperature and to understand the effects of
the various predictors.
At each step of the analysis you may assume that things learned earlier in the process are known.
Units Note: The "degrees" of temperature, given here on the Fahrenheit scale, have only coincidental language relationship to
the "degrees" of longitude and latitude. The geographic "degrees" are based on modeling the Earth as a sphere and dividing it
up into 360 degrees for a full circle. Thus 180 degrees of longitude is halfway around the world from Greenwich, England
(0°) and Latitude increases from 0 degrees at the Equator to 90 degrees of (North) latitude at the North Pole. 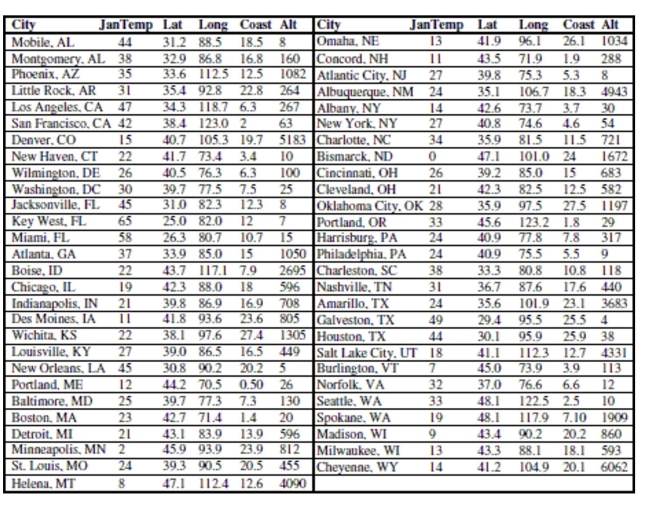
-First, we consider the relationship between temperature and latitude. This seems to be the
obvious first choice; everybody knows that northern (high latitude) cities tend to be colder
in January than southern (lower latitude) cities. Here is the scatterplot: 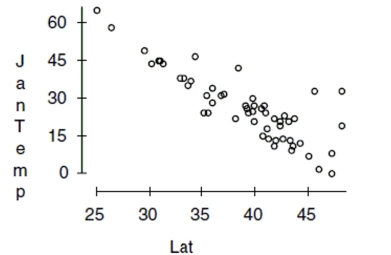
Describe what you see in this scatterplot in a sentence or two. Which of the regression
assumptions for the regression of Jantemp on Lat can you check with this plot? State them
and indicate whether you think they seem to be satisfied.
Definitions:
Retained Earnings
The portion of a company's profits that are not distributed as dividends to shareholders but are kept by the company for reinvestment.
Retained Earnings
The portion of a company's profits that is kept or retained and not paid out as dividends to shareholders.
Dividends
Payments made by a corporation to its shareholder members. It is the share of profits and retained earnings that the company pays out to its shareholders.
Net Loss
The amount by which a company's total expenses exceed its total revenues, indicating a negative financial performance.
Q16: A regression equation is obtained for
Q26: The test scores of 32 students
Q53: A contact lens wearer read that
Q54: Twenty-four workers were surveyed about how
Q88: Name and describe the kind of bias
Q96: Does regular exercise decrease the risk of
Q122: The speeds (in mi/h) of the
Q137: What is the probability that he does
Q143: What is the probability that two customers
Q166: The highest temperatures ever recorded (in