Of the 23 first year male students at State U. admitted from Jim Thorpe High School, 8 were offered baseball scholarships and 7 were offered football scholarships. The University admissions committee looked at the students' composite ACT scores (shown in table), wondering if the University was lowering their standards for athletes. Assuming that this group of students is representative of all admitted students, what do you think?
Composite ACT Score
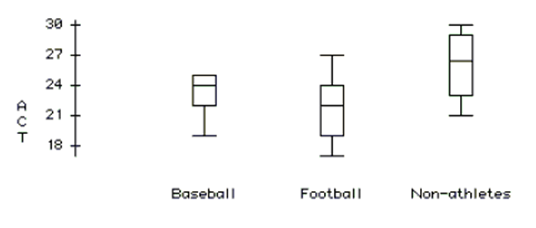
Baseball 2522192524252423 Non-athletes 2127292630272623Football 22212427192317
Boxplots:
Analysis of Variance Table
SourceTeamErrorTotal Sums of Squares 71.00155.61226.61df22022 Mean Squares 35.507.78 F-ratio 4.56 P- value 0.023
Means and Std Deviations
Level BaseballFootball Non AthleteNumber878Mean 23.375021.857126.1250Std Dev2.065883.287782.94897
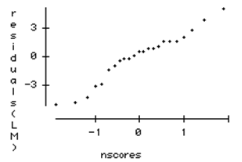
Normal Probability Plot:
-Test an appropriate hypothesis and state your conclusion
Recognize the importance of self-empowerment and moving forward after experiencing disillusionment.
Acknowledge the role of anticipatory anxiety and how it can impact the beginning of an internship.
Understand the importance of accepting grunt work as a learning opportunity within High-Quality Internships (HQI).
Comprehend how interns’ perceptions of coworker expectations and their own role influence their internship experience.
Reward
Any form of compensation, recognition, or benefit used to reinforce positive behavior and outcomes within an organization.
Desirable Behavior
Behavior that is seen as positive or beneficial within a given context, often encouraged by society or organizations.
Secondary Reinforcer
A stimulus that has become reinforcing by being associated with a primary reinforcer; it indirectly satisfies biological needs.
Neutral Value
A concept or object regarded as being without inherent positive or negative connotations or effects, often seen in a neutral context.