Penicillin Doctors studying how the human body assimilates medication inject some
patients with penicillin, and then monitor the concentration of the drug (in units/cc) in the
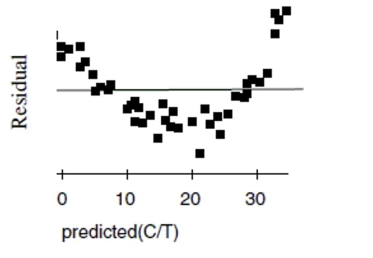
patients' blood for seven hours. The data are shown in the scatterplot. First they tried to fit
a linear model. The regression analysis and residuals plot are shown. Dependent variable is:
Concentration
No Selector
R squared R squared (adjusted)
with degrees of freedom
a. Find the correlation between time and concentration.
b. Using this model, estimate what the concentration of penicillin will be after 4 hours.
c. Is that estimate likely to be accurate, too low, or too high? Explain.
Now the researchers try a new model, using the re-expression log(Concentration). Examine
the regression analysis and the residuals plot below. Dependent variable is: LogCnn
No Selector
R squared R squared (adjusted)
with degrees of freedom
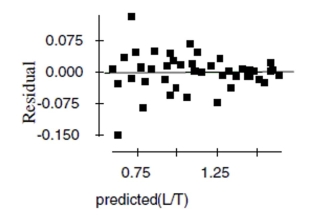
d. Explain why you think this model is better than the original linear model.
e. Using this new model, estimate the concentration of penicillin after 4 hours.
Definitions:
Q25: Many school administrators watch enrollment numbers for
Q47: Which is true about a 98% confidence
Q59: Soft drinks A restaurant owner wanted to
Q101: Approval rating The President's job approval rating
Q104: We can tell that these two features
Q111: We are about to test a
Q125: Which of the following is true about
Q147: Grades You believe that there is a
Q568: After conducting a survey of his students,
Q729: The two samples whose statistics are