Crawling Researchers at the University of Denver Infant Study Center investigated whether babies take longer to learn to crawl in cold months (when they are often bundled in clothes that restrict their movement) than in warmer months. The study sought an association between babies' first crawling age (in weeks) and the average temperature during the month they first try to crawl (about 6 months after birth). Between 1988 and 1991 parents reported the birth month and age at which their child was first able to creep or crawl a distance of four feet in one minute. Data were collected on 208 boys and 206 girls. The graph below plots average crawling ages (in weeks) against the mean temperatures when the babies were 6 months old. The researchers found a correlation of and their line of best fit was
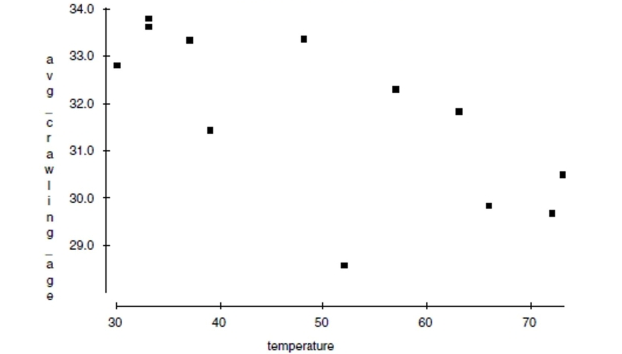
a. Draw the line of best fit on the graph. (Show your method clearly.)
b. Describe the association in context.
c. Explain (in context) what the slope of the line means.
d. Explain (in context) what the y-intercept of the line means.
e. Explain (in context) what
means.
f. In this context, what does a negative residual indicate?
Definitions:
Bonds Dated
The date specified in the bond document when the bond was issued, important for determining interest payments and maturity.
Fair Value
An estimate of the price at which an asset would be bought or sold in a current transaction between willing parties, not under compulsion.
Market Price
The prevailing market rate at which transactions for assets or services are conducted.
Investment Sold
The act of divesting an asset or security, converting an investment back into cash or its cash equivalent.
Q19: School administrators collect data on students attending
Q77: What is the marginal distribution of milk
Q83: Another company's sales increase by the same
Q118: According to the National Telecommunication and Information
Q145: A professor was curious about her
Q146: Interpret the slope of your model in
Q252: If the diameter is increased from 4
Q346: Medical records indicate that people with more
Q521: Suppose that a device advertised to
Q666: Do the data indicate that anxiety levels