The pie-chart shown below gives the responses answered on Question 12 of a recent Finite Math final exam. The question was a multiple choice question with options (A, B, C, D, or E). Assuming that the graph was created correctly, what number of responses had option D as the choice? Note that the angle measures for each pie slice are given. 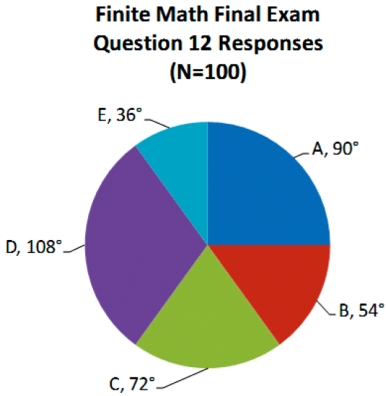 (a) 30
(b) 36
(c) 60
(d) 108
(e) None of the above.
Definitions:
Direct Labour Hours
The total hours worked by employees directly involved in the manufacturing process of a product.
Static Budget
A budget based on a fixed set of assumptions that don't change over the period it covers, regardless of actual changes in volume or activity levels.
Standard Costing
Standard Costing is a cost accounting method that uses fixed overhead rates and standard costs for materials and labor to help control costs and measure performance.
Variable Overhead
Variable overhead refers to costs that vary with production levels, such as utility expenses for machinery or materials, fluctuating with the volume of output.
Q7: Refer to the situation in above ;
Q9: You plan on constructing a Koch snowflake
Q11: Consider the digraph with vertex set V
Q11: Refer to the situation described above ;
Q16: The minimum number of weighings with a
Q17: If <img src="https://d2lvgg3v3hfg70.cloudfront.net/TB34225555/.jpg" alt="If represents
Q21: Based on the above scenario ,
Q39: Rectangle A has dimensions of 6 by
Q51: <img src="https://d2lvgg3v3hfg70.cloudfront.net/TB6843/.jpg" alt=" " class="answers-bank-image d-block" rel="preload"
Q70: If R = {(1, 2), (1, 4),