The following scatterplot shows the percentage of the vote a candidate received in the 2004 senatorial elections according to the voter's income level based on an exit poll of voters conducted by CNN. The income levels 1-8 correspond to the
Following income classes: 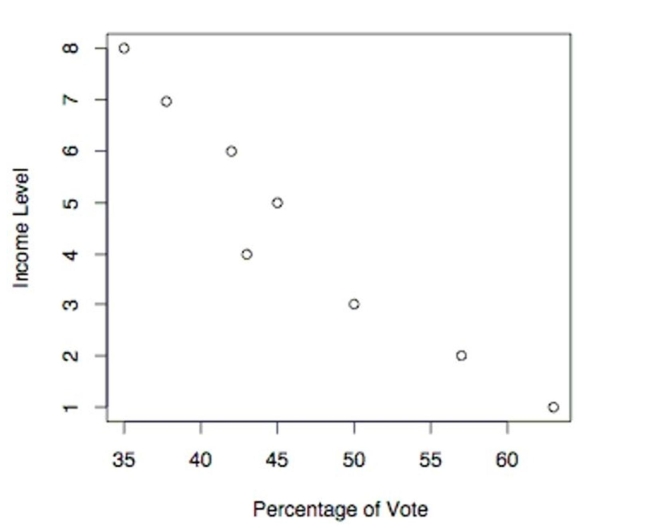 Use the election scatterplot to determine whether there is a correlation between percentage of vote and income level at
The 0.01 significance level with a null hypothesis of
Definitions:
F Ratio
A statistical measure used in the analysis of variance (ANOVA) to determine the ratio of variance between groups to the variance within groups.
Significant
In a statistical context, denotes results that are unlikely to have occurred by chance, indicating a meaningful difference or relationship.
Type I Errors
False positive conclusions in statistical hypothesis testing, erroneously indicating that a novel effect exists.
Type II Errors
Occurs in hypothesis testing when the null hypothesis is falsely accepted, meaning that a real effect or difference is missed.
Q2: Assume that ten percent of us are
Q19: An x chart based on standard
Q49: Find the ranks corresponding to the
Q74: Use the rank correlation coefficient to
Q85: The following data shows the yield,
Q141: <span class="ql-formula" data-value="\begin{array} { l l l
Q152: A collection of paired data consists
Q163: The heights of the adults in one
Q198: The ages of the 35 members
Q208: A class of sixth grade students