Multiple Choice
The following data was collected comparing car prices and quantity sold (thousands) . 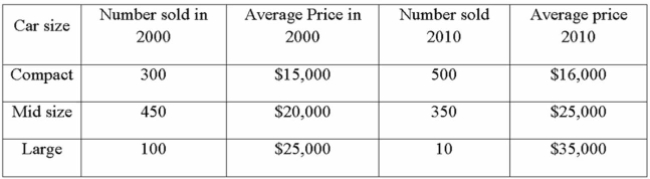 Compute the Paasche price index to compare car prices in 2010 to 2000.
Definitions:
Related Questions
Q5: The information below is from the multiple
Q8: The educational level and the social activity
Q13: The following ages (rounded to the nearest
Q20: Listed below are the top-steel producing nations,
Q21: Listed below is the net sales in
Q26: The wholesale price of a straight back
Q46: The following table lists the average price
Q50: (i. Correct to two decimal places, the
Q125: i. If we are studying the relationship
Q142: Below is a summary of the size