Using the graph below for cases of microwave popcorn, calculate:
a. equilibrium price.
b. equilibrium quantity.
c. consumer surplus.
d. producer surplus.
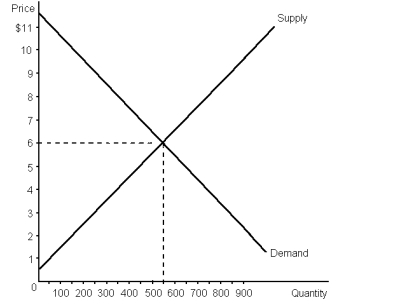
Now suppose that the government imposes a flat $2 tax per case on the sellers of microwave popcorn. Show this on the graph and calculate each of the following after the tax is imposed:
e. price paid by buyers
f. price received by sellers
g. consumer surplus
h. producer surplus
i. government revenue
j. deadweight loss
Definitions:
Total Revenue
The total amount of money received by a company from selling goods or services before any expenses are deducted.
Inverse Demand Function
A mathematical representation that describes the relationship between the price of a good and the quantity that consumers are willing and able to purchase, expressed as price as a function of quantity demanded.
Marginal Cost
The expenditure involved in the production of an extra unit of a good or service.
Elasticity of Demand
An indicator of the degree to which demand for a product changes in response to a variation in its price, shown as a percentage.
Q6: Katie owns a rabbit which loves to
Q14: In Graph 7-4, at the market-clearing equilibrium,
Q46: According to Graph 8-1, the tax caused
Q46: In part as an effort to discourage
Q61: In Graph 9-3, after the quota, deadweight
Q63: Suppose the price of product X is
Q85: In France, drivers in one central region
Q89: Price controls often help those in need.
Q92: 'Assume that the demand for entertainment is
Q106: Many advocates of raising the minimum wage