TABLE 10-13
The amount of time required to reach a customer service representative has a huge impact on customer satisfaction. Below is the Excel output from a study to see whether there is evidence of a difference in the mean amounts of time required to reach a customer service representative between two hotels. Assume that the population variances in the amount of time for the two hotels are not equal.
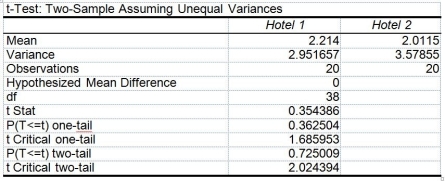
-Referring to Table 10-13, state the null and alternative hypotheses for testing if there is evidence of a difference in the variabilities of the amount of time required to reach a customer service representative between the two hotels.
Definitions:
Shape Of The Distribution
The form or appearance of the graphed data, which can include characteristics like symmetry, skewness, peakedness, and the presence of outliers.
Spread Or Variability
The extent to which a dataset differs from its mean, indicating how much the data points are spread out or clustered together.
Statistical Inference
The process of using data analysis to deduce properties of an underlying probability distribution.
Line Chart
A type of chart which displays information as a series of data points called 'markers' connected by straight line segments.
Q57: Referring to Table 11-8, the randomized block
Q76: Referring to Table 10-13, what assumptions are
Q88: Referring to Table 8-8, it is possible
Q91: Referring to Table 12-16, which is the
Q96: Referring to Table 8-13, we are 95%
Q100: The standardized normal distribution is used to
Q104: The Wall Street Journal recently ran an
Q130: Referring to Table 11-4, the within-group variation
Q178: Referring to Table 12-4, the critical value
Q198: If you are comparing the mean sales