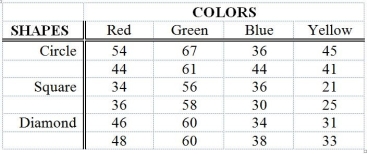
TABLE 11-12
The marketing manager of a company producing a new cereal aimed for children wants to examine the effect of the color and shape of the box's logo on the approval rating of the cereal. He combined 4 colors and 3 shapes to produce a total of 12 designs. Each logo was presented to 2 different groups (a total of 24 groups) and the approval rating for each was recorded and is shown below. The manager analyzed these data using the α = 0.05 level of significance for all inferences.

Analysis of Variance
Source df SS MS F p
Colors 3 2711.17 903.72 72.30 0.000
Shapes 2 579.00 289.50 23.16 0.000
Interaction 6 150.33 25.06 2.00 0.144
Error 12 150.00 12.50
Total 23 3590.50
-Referring to Table 11-12, the critical value in the test for significant differences between shapes is ________.
Definitions:
Capital
Financial assets or the financial value of assets, such as cash and buildings, used by a business to produce goods and services.
Human Labor
This is the effort contributed by humans in the production process, including physical and intellectual contributions.
Marginal Productivity Theory
An economic theory that suggests that the amount of compensation or wage received by a resource (like labor) is determined by its marginal productivity or the additional output generated by using one more unit of the resource.
Income Distribution
Describes how a nation’s total GDP is distributed amongst its population, impacting levels of wealth and poverty.
Q75: The interpretation of the slope is different
Q83: Referring to Table 13-9, the 90% confidence
Q88: Referring to Table 11-3, the sporting goods
Q102: Referring to Table 12-14, the director now
Q105: When r = -1, it indicates a
Q120: Referring to Table 12-8, at 5% level
Q121: Referring to Table 11-11, interpret the test
Q157: Referring to Table 13-13, the decision on
Q291: Referring to Table 14-2, for these data,
Q310: Referring to Table 14-4, what is the