TABLE 13-5
The managing partner of an advertising agency believes that his company's sales are related to the industry sales. He uses Microsoft Excel to analyze the last 4 years of quarterly data (i.e., n = 16) with the following results: 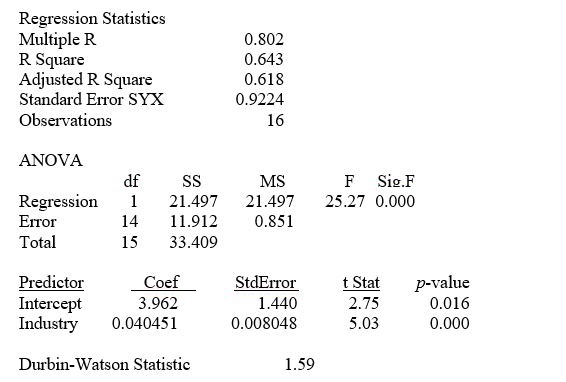
-Referring to Table 13-5, the partner wants to test for autocorrelation using the Durbin-Watson statistic. Using a level of significance of 0.05, the decision he should make is
Definitions:
Input
Resources used in the production process, including labor, materials, machinery, and other factors of production.
Demand
The volume of goods or services that individuals are prepared and financially able to acquire at varying price points during a certain time span.
Perfectly Competitive Labor Market
A theoretical market where numerous employers and employees interact, with no single entity able to influence wages or working conditions.
Wages
The compensation received by employees for their labor, typically expressed as an hourly rate or annual salary.
Q8: Referring to Table 13-2, what percentage of
Q19: Referring to Table 11-11, what was the
Q64: Referring to Table 13-3, suppose the director
Q84: Referring to Table 13-11, the homoscedasticity of
Q104: Referring to Table 13-11, there appears to
Q129: Referring to Table 11-2, the within group
Q148: Referring to Table 11-11, what assumption(s) need(s)
Q149: Referring to Table 13-4, the coefficient of
Q179: Referring to Table 12-11, the test will
Q194: If the assumptions of the one-way ANOVA