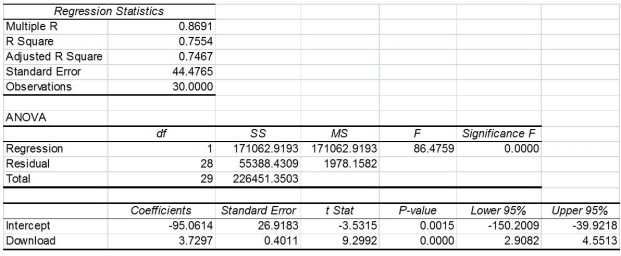
TABLE 13-11
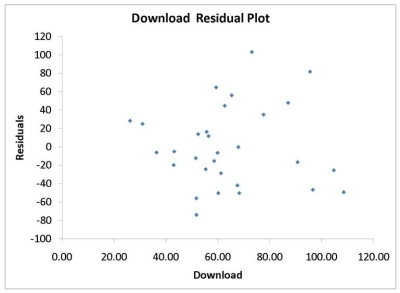
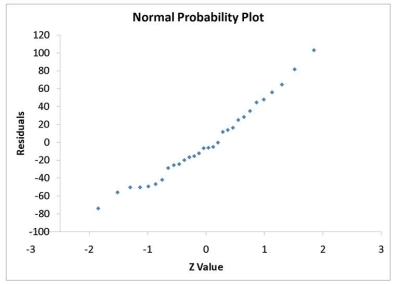
A computer software developer would like to use the number of downloads (in thousands) for the trial version of his new shareware to predict the amount of revenue (in thousands of dollars) he can make on the full version of the new shareware. Following is the output from a simple linear regression along with the residual plot and normal probability plot obtained from a data set of 30 different sharewares that he has developed:


-Referring to Table 13-11, there appears to be autocorrelation in the residuals.
Definitions:
Economic Order Quantity Model
A formula used in inventory management for determining the optimal order size that minimizes the total costs of holding inventory and ordering.
Setup Cost
The cost incurred to prepare equipment or processes for production.
Holding Cost
The expenses incurred by storing unsold goods, encompassing warehousing, insurance, and spoilage costs.
EOQ Model
Economic Order Quantity model determines the optimal order quantity that minimizes the total inventory costs, including ordering and holding costs.
Q2: Referring to Table 11-8, the decision made
Q8: Referring to Table 14-10, to test the
Q45: Referring to Table 14-17 Model 1, what
Q77: Referring to Table 15-6, the model that
Q81: A regression diagnostic tool used to study
Q82: Referring to Table 12-6, what are the
Q109: The procedure for the Wilcoxon rank sum
Q140: Referring to Table 11-8, the among-group variation
Q141: Referring to Table 12-11, the same decision
Q200: Referring to Table 12-6, what is the