TABLE 13-12
The manager of the purchasing department of a large saving and loan organization would like to develop a model to predict the amount of time (measured in hours) it takes to record a loan application. Data are collected from a sample of 30 days, and the number of applications recorded and completion time in hours is recorded. Below is the regression output:
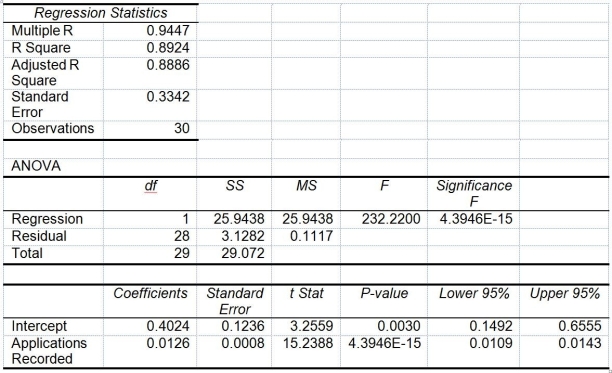
Note: 4.3946E-15 is 4.3946 ×

-Referring to Table 13-12, the p-value of the measured F test statistic to test whether the number of loan applications recorded affects the amount of time is
Definitions:
Cubic Feet
A unit of volume measurement in the imperial system, used to quantify the space an object occupies, often represented as ft³.
Sales Commission
A payment made to sales personnel, often calculated as a percentage of the sales they generate.
After-Tax Profits
Net income after accounting for all taxes, representing the company's profit remaining after tax expenses.
Q34: Referring to Table 11-6, the agronomist decided
Q38: Referring to Table 14-5, the observed value
Q48: Referring to Table 12-19, to use the
Q62: If we use the X² method of
Q65: Referring to Table 12-16, in order to
Q69: Referring to Table 12-20, what is the
Q69: Referring to Table 13-4, the managers of
Q77: Referring to Table 15-6, the model that
Q179: Referring to Table 11-6, the randomized block
Q337: Referring to Table 14-2, for these data,