TABLE 14-3
An economist is interested to see how consumption for an economy (in $ billions) is influenced by gross domestic product ($ billions) and aggregate price (consumer price index) . The Microsoft Excel output of this regression is partially reproduced below. 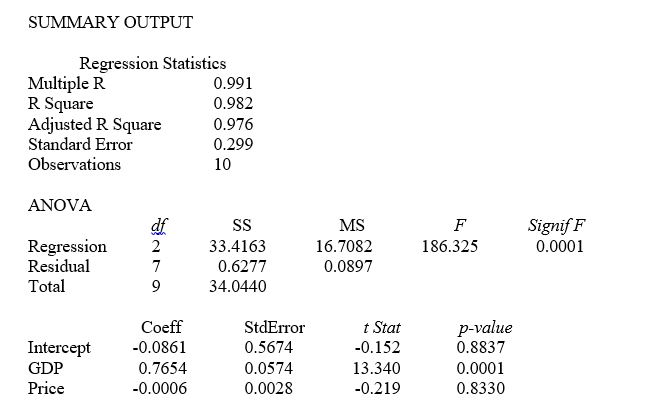
-Referring to Table 14-3, to test for the significance of the coefficient on aggregate price index, the p-value is
Definitions:
Consumer Goods
Goods produced for present consumption.
Capital Goods
Long-lasting tangible items that businesses use to produce goods or services, such as machinery, buildings, and equipment.
Technological Improvements
Enhancements or advancements in technology that increase productivity or efficiency in processes, products, or services.
Production Inefficiencies
Situations where resources are not used in the most productive way, leading to wastage and a lower output than potentially achievable.
Q11: Referring to Table 15-6, the model that
Q28: Referring to Table 14-14, the predicted mileage
Q66: Referring to Table 15-3, suppose the chemist
Q79: Referring to Table 15-4, the better model
Q82: Referring to Table 16-4, exponential smoothing with
Q94: Referring to Table 14-10, the total degrees
Q95: Referring to Table 13-13, if the state
Q131: Referring to Table 13-12, the 90% confidence
Q184: Referring to Table 14-3, the p-value for
Q327: Referring to Table 14-12, what is the