TABLE 15-4

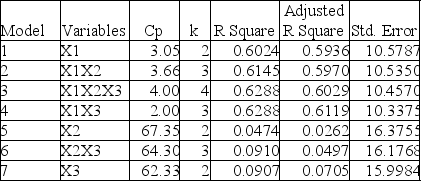
The output from the best-subset regressions is given below:

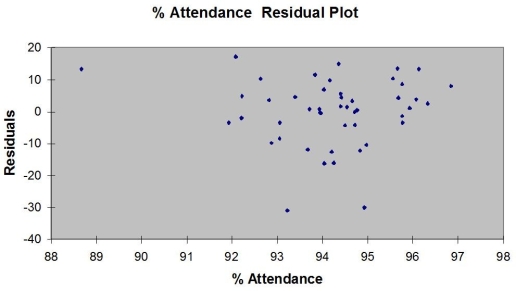
Following is the residual plot for % Attendance:

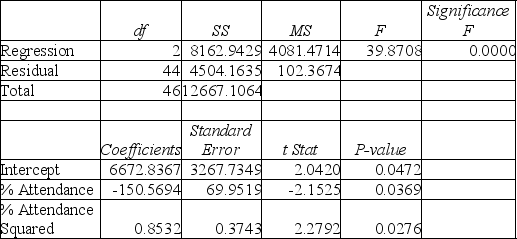
Following is the output of several multiple regression models:
Model (I) :

Model (II) :

Model (III) :

-Referring to Table 15-4, the better model using a 5% level of significance derived from the "best" model above is
Definitions:
Random Assignment
A method used in experiments to place participants into different groups in a way that each participant has an equal chance of being in any group, minimizing biases.
Participants
Individuals who take part in a study or experiment and whose behavior or responses are observed or measured.
Experiment
A study in which people are randomly assigned to a condition.
Causation
The relationship between cause and effect where one event (the cause) directly results in the occurrence of another event (the effect).
Q80: Referring to Table 15-6, what is the
Q91: Referring to Table 17-10, a c chart
Q92: Referring to Table 9-3, if you select
Q95: Referring to 14-16, what is the value
Q101: Referring to Table 16-14, the best interpretation
Q114: Referring to Table 16-13, what is your
Q119: Referring to Table 17-3, suppose the analyst
Q146: If a time series does not exhibit
Q291: Referring to Table 14-2, for these data,
Q350: Referring to Table 14-17 and using both