TABLE 14-5
A microeconomist wants to determine how corporate sales are influenced by capital and wage spending by companies. She proceeds to randomly select 26 large corporations and record information in millions of dollars. The Microsoft Excel output below shows results of this multiple regression. 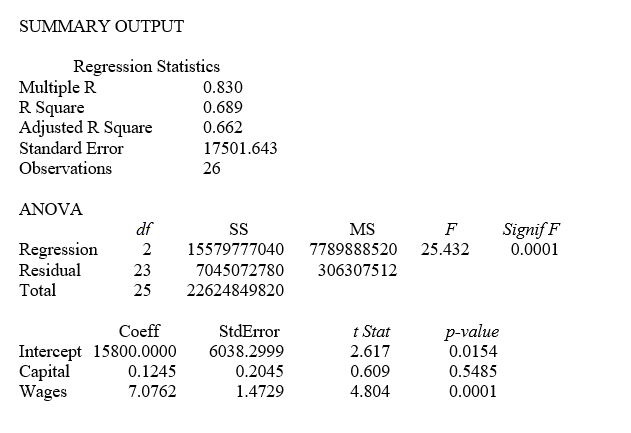
-Referring to Table 14-5, what is the p-value for Wages?
Definitions:
Drafting Documents
The process of creating legal documents requiring specific legal language and adherence to legal protocols.
Client Relations
The practices and strategies that businesses use to maintain and enhance the relationships with their clients.
Research
The systematic investigation into and study of materials and sources in order to establish facts and reach new conclusions.
Semester Hours
Units of credit earned in college or university, representing the number of hours spent in a class each week throughout a semester.
Q2: Referring to Table 14-7, the department head
Q14: Referring to Table 13-12, the value of
Q41: Referring to Table 12-19, the sporting goods
Q64: When a time series appears to be
Q150: Referring to Table 16-8, the fitted value
Q156: Referring to Table 14-5, what are the
Q169: Referring to Table 11-12, the value of
Q172: Referring to Table 11-11, what degrees of
Q199: Referring to Table 13-11, what is the
Q326: Referring to 14-16, the error appears to