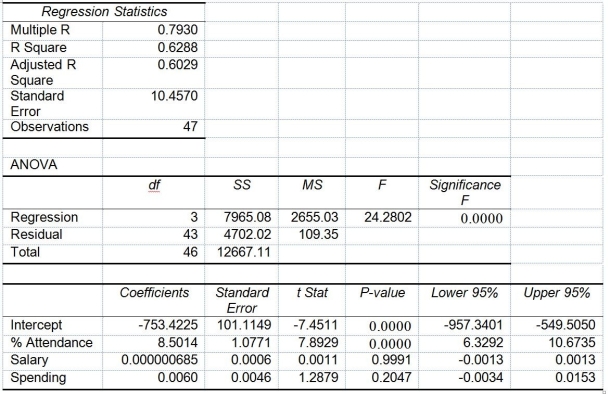
TABLE 14-15
The superintendent of a school district wanted to predict the percentage of students passing a sixth-grade proficiency test. She obtained the data on percentage of students passing the proficiency test (% Passing), daily mean of the percentage of students attending class (% Attendance), mean teacher salary in dollars (Salaries), and instructional spending per pupil in dollars (Spending) of 47 schools in the state.
Following is the multiple regression output with Y = % Passing as the dependent variable, X₁ = % Attendance, X₂= Salaries and X₃= Spending:

-Referring to Table 14-15, the null hypothesis H₀: = β₁ = β₂ = β₃ = 0 implies that percentage of students passing the proficiency test is not related to one of the explanatory variables.
Definitions:
Payback Period
The period of time required for an investment to generate cash flows sufficient to recover its initial cost.
Factory Overhead
All indirect costs associated with the manufacturing process, excluding direct materials and direct labor costs.
Depreciation
The methodical distribution of the expense of a physical asset throughout its lifespan.
Payback Period
A financial metric that calculates the time required for an investment to generate cash flows sufficient to recover the initial investment cost.
Q3: Referring to Table 16-7, the forecast for
Q34: Referring to Table 13-4, the managers of
Q69: Referring to Table 15-5, what is the
Q74: Referring to Table 14-17 Model 1, which
Q108: Referring to Table 14-17 and using both
Q122: Referring to Table 14-15, the null hypothesis
Q170: Referring to Table 13-4, the total sum
Q211: Referring to Table 13-5, the standard error
Q289: Referring to Table 14-6, what are the
Q317: Referring to Table 14-15, you can conclude