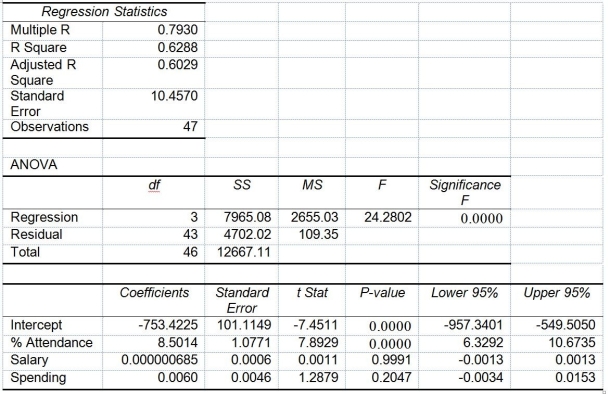
TABLE 14-15
The superintendent of a school district wanted to predict the percentage of students passing a sixth-grade proficiency test. She obtained the data on percentage of students passing the proficiency test (% Passing), daily mean of the percentage of students attending class (% Attendance), mean teacher salary in dollars (Salaries), and instructional spending per pupil in dollars (Spending) of 47 schools in the state.
Following is the multiple regression output with Y = % Passing as the dependent variable, X₁ = % Attendance, X₂= Salaries and X₃= Spending:

-Referring to Table 14-15, what are the lower and upper limits of the 95% confidence interval estimate for the effect of a one dollar increase in mean teacher salary on the mean percentage of students passing the proficiency test?
Definitions:
Diseconomies Of Scale
Exist when average costs rise with output.
Marginal Costs
The cost associated with producing one additional unit of a product, useful for decision-making on production levels and pricing.
Constant Returns To Scale
When average costs are constant with respect to output level.
Economies Of Scale
Cost advantages that enterprises obtain due to their scale of operation, with cost per unit of output decreasing with increasing scale.
Q25: Referring to Table 15-6, what is the
Q28: Referring to Table 16-13, the best model
Q84: Referring to Table 13-11, the homoscedasticity of
Q85: Referring to Table 16-5, the number of
Q99: Referring to Table 13-11, what is the
Q107: Referring to Table 16-10, the fitted values
Q114: Referring to Table 16-13, what is your
Q161: Referring to Table 16-5, the number of
Q251: Referring to Table 14-15, what is the
Q328: Referring to 14-16, there is enough evidence