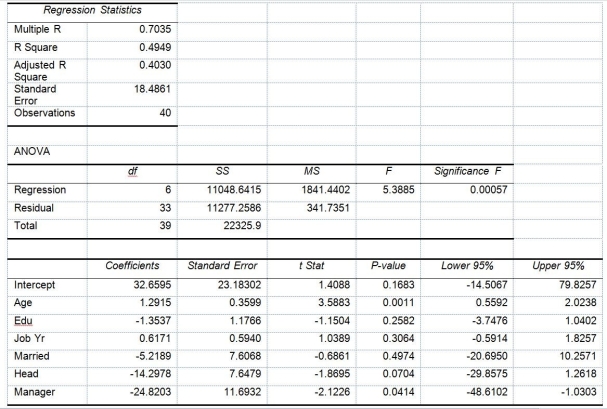
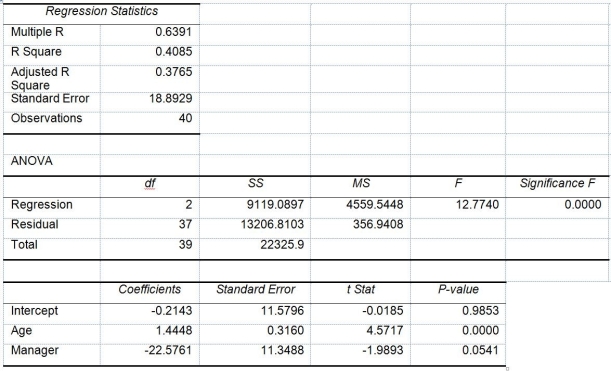
TABLE 14-17


Model 2 is the regression analysis where the dependent variable is Unemploy and the independent variables are
Age and Manager. The results of the regression analysis are given below:

-Referring to Table 14-17 Model 1, what are the lower and upper limits of the 95% confidence interval estimate for the effect of a one year increase in education received on the mean number of weeks a worker is unemployed due to a layoff after taking into consideration the effect of all the other independent variables?
Definitions:
Q14: Referring to Table 16-13, you can reject
Q20: After estimating a trend model for annual
Q23: A survey claims that 9 out of
Q56: Referring to Table 17-3, suppose the analyst
Q67: Referring to Table 17-8, an R chart
Q86: Referring to Table 15-6, what is the
Q88: Referring to Table 13-10, the null hypothesis
Q133: The method of least squares may be
Q152: Regression analysis is used for prediction, while
Q218: Referring to Table 14-19, the null hypothesis