TABLE 14-3
An economist is interested to see how consumption for an economy (in $ billions) is influenced by gross domestic product ($ billions) and aggregate price (consumer price index) . The Microsoft Excel output of this regression is partially reproduced below. 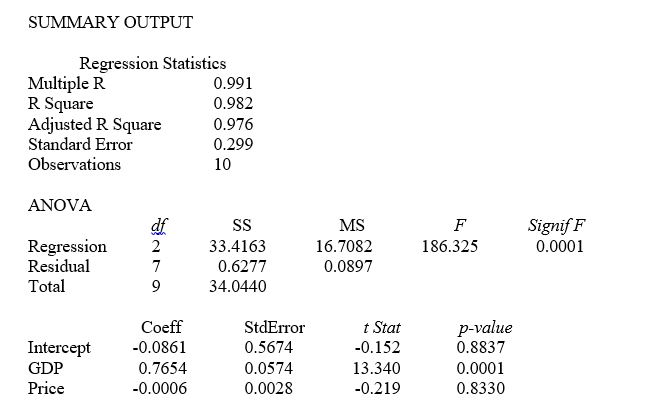
-Referring to Table 14-3, to test for the significance of the coefficient on gross domestic product, the p-value is
Definitions:
Exponential Smoothing Model
A time series forecasting method for univariate data that applies exponentially decreasing weights over past observations.
Forecast
A prediction or estimate of future events, especially regarding weather or economic trends.
Sales Details
Information and data related to the sales performance of products or services, including quantities sold, revenue generated, and trends over time.
Value of K
A specific numerical quantity or parameter that might have different meanings depending on the context in which it's used.
Q19: Referring to Table 13-11, the null hypothesis
Q29: Referring to Table 14-17 Model 1, there
Q40: Referring to Table 15-2, given a quadratic
Q42: Referring to 14-16, there is enough evidence
Q94: Referring to Table 12-7, there is sufficient
Q141: Referring to Table 12-11, the same decision
Q152: Referring to Table 12-7, the null hypothesis
Q162: Referring to Table 14-11, which of the
Q344: Referring to Table 14-8, the value of
Q346: Referring to Table 14-5, what are the