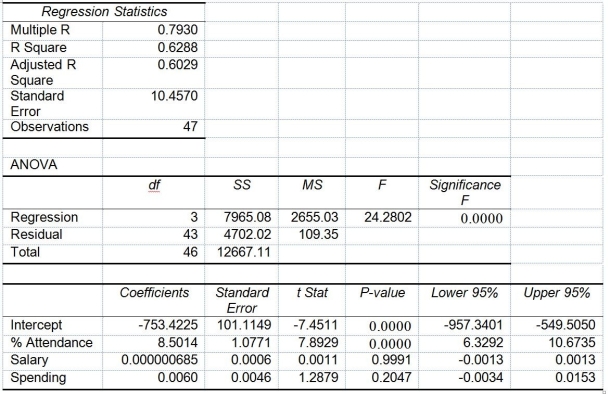
TABLE 14-15
The superintendent of a school district wanted to predict the percentage of students passing a sixth-grade proficiency test. She obtained the data on percentage of students passing the proficiency test (% Passing), daily mean of the percentage of students attending class (% Attendance), mean teacher salary in dollars (Salaries), and instructional spending per pupil in dollars (Spending) of 47 schools in the state.
Following is the multiple regression output with Y = % Passing as the dependent variable, X₁ = % Attendance, X₂= Salaries and X₃= Spending:

-Referring to Table 14-15, the null hypothesis H₀: = β₁ = β₂ = β₃ = 0 implies that percentage of students passing the proficiency test is not affected by some of the explanatory variables.
Definitions:
Immigrants
Individuals who move from one country to another, typically for the purpose of seeking employment, better living conditions or to escape conflict.
Older Workers
Individuals in the workforce who are near or beyond the customary retirement age, often valued for their experience and work ethic.
Age Discrimination
The unequal treatment of individuals due to their age, particularly in employment settings.
Mean
A statistical measure representing the average value of a set of numbers.
Q28: Referring to Table 15-6, what is the
Q61: Referring to Table 16-14, in testing the
Q82: Referring to Table 13-3, the least squares
Q125: The fairly regular fluctuations that occur within
Q126: Referring to Table 13-4, suppose the managers
Q137: Referring to Table 14-15, you can conclude
Q177: Referring to Table 14-8, the value of
Q189: Referring to Table 13-3, the director of
Q247: In a multiple regression model, the adjusted
Q278: Referring to 14-16, _ of the variation