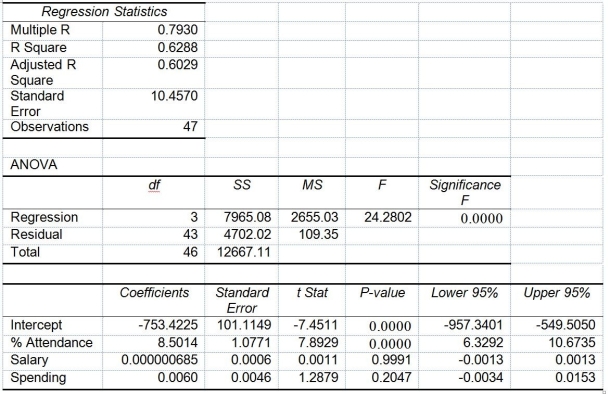
TABLE 14-15
The superintendent of a school district wanted to predict the percentage of students passing a sixth-grade proficiency test. She obtained the data on percentage of students passing the proficiency test (% Passing), daily mean of the percentage of students attending class (% Attendance), mean teacher salary in dollars (Salaries), and instructional spending per pupil in dollars (Spending) of 47 schools in the state.
Following is the multiple regression output with Y = % Passing as the dependent variable, X₁ = % Attendance, X₂= Salaries and X₃= Spending:

-Referring to Table 14-15, the null hypothesis should be rejected at a 5% level of significance when testing whether there is a significant relationship between percentage of students passing the proficiency test and the entire set of explanatory variables.
Definitions:
Preventive Maintenance
Regular and systematic inspection, cleaning, and repair of equipment and facilities to prevent sudden failure and ensure efficient operation.
Reactive
Responding to changes or issues as they occur rather than anticipating and preparing for them in advance.
MTBF Distributions
Mean Time Between Failures distributions, a statistical measure used to describe the expected reliability or availability of a system over time.
Infant Mortality
The failure rate early in the life of a product or process.
Q7: The goals of model building are to
Q9: Referring to Table 12-12, if the null
Q34: Referring to Table 15-3, suppose the chemist
Q34: Referring to Table 16-14, in testing the
Q63: Referring to Table 16-12, the best interpretation
Q77: Referring to Table 14-7, the department head
Q88: Given a data set with 15 yearly
Q104: Referring to Table 17-6, construct a p
Q138: An interaction term in a multiple regression
Q146: If a time series does not exhibit