TABLE 15-1
A certain type of rare gem serves as a status symbol for many of its owners. In theory, for low prices, the demand increases and it decreases as the price of the gem increases. However, experts hypothesize that when the gem is valued at very high prices, the demand increases with price due to the status owners believe they gain in obtaining the gem. Thus, the model proposed to best explain the demand for the gem by its price is the quadratic model:
Y = β₀ + β₁X + β₁X² + ε
where Y = demand (in thousands) and X = retail price per carat.
This model was fit to data collected for a sample of 12 rare gems of this type. A portion of the computer analysis obtained from Microsoft Excel is shown below: 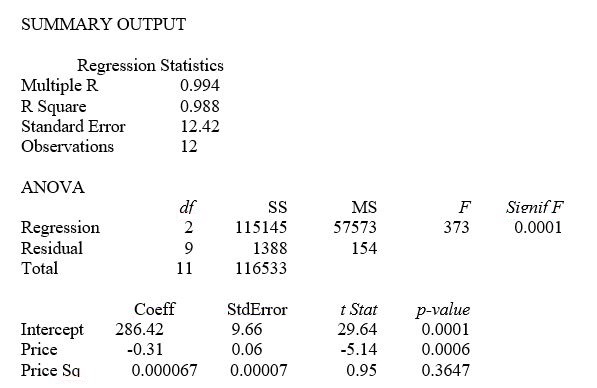
-Referring to Table 15-1, what is the p-value associated with the test statistic for testing whether there is an upward curvature in the response curve relating the demand (Y) and the price (X) ?
Definitions:
Presbyopia
A natural age-related loss of the eyes' ability to focus on close objects, due to the hardening of the lens inside the eye.
Elasticity
In economics, it measures how the quantity demanded or supplied responds to changes in price or income.
Optometrist
A healthcare professional who provides primary vision care, ranging from sight testing and correction to the diagnosis, treatment, and management of vision changes.
Lens
The transparent disk-shaped structure behind the iris and the pupil that changes shape as it focuses on objects at varying distances.
Q19: Referring to Table 14-11, the overall model
Q23: Referring to Table 15-4, the null hypothesis
Q26: A researcher randomly sampled 30 graduates, 18
Q37: A survey was conducted to determine how
Q42: If a new machine of a production
Q67: Referring to table 13-11, which of the
Q97: What do we mean when we say
Q102: Referring to Table 14-18, what is the
Q158: Referring to Table 13-10, what is the
Q195: Referring to Table 14-4, when the builder