TABLE 15-1
A certain type of rare gem serves as a status symbol for many of its owners. In theory, for low prices, the demand increases and it decreases as the price of the gem increases. However, experts hypothesize that when the gem is valued at very high prices, the demand increases with price due to the status owners believe they gain in obtaining the gem. Thus, the model proposed to best explain the demand for the gem by its price is the quadratic model:
Y = β₀ + β₁X + β₁X² + ε
where Y = demand (in thousands) and X = retail price per carat.
This model was fit to data collected for a sample of 12 rare gems of this type. A portion of the computer analysis obtained from Microsoft Excel is shown below: 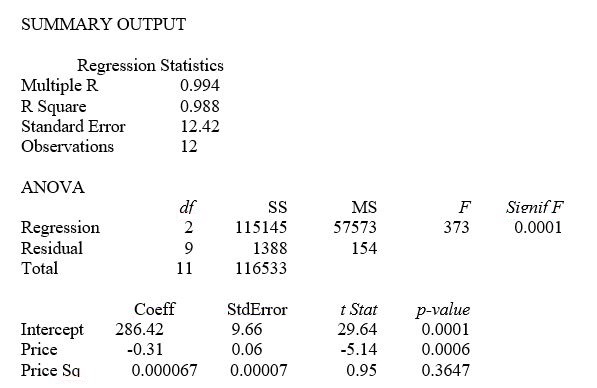
-Referring to Table 15-1, does there appear to be significant upward curvature in the response curve relating the demand (Y) and the price (X) at 10% level of significance?
Definitions:
Coffee
A popular beverage made by brewing roasted and ground beans of the Coffea plant.
Production
The process of creating goods or services by combining various inputs like labour, materials, and machinery.
Circular-Flow Diagram
A graphical representation of the economic system illustrating the circulation of money between households and companies through various markets.
Market
A forum where buyers and sellers come together to exchange goods, services, or information.
Q11: A least squares linear trend line is
Q17: Referring to Table 13-10, what is the
Q35: Referring to Table 17-3, suppose the analyst
Q54: Referring to Table 17-3, suppose the analyst
Q70: One of the consequences of collinearity in
Q73: Referring to Table 14-17 Model 1, the
Q89: Referring to Table 17-7, what percentage of
Q95: Referring to 14-16, what is the value
Q285: Referring to Table 14-7, the department head
Q289: Referring to Table 14-6, what are the