TABLE 15-6
Given below are results from the regression analysis on 40 observations where the dependent variable is the number of weeks a worker is unemployed due to a layoff (Y) and the independent variables are the age of the worker (X₁), the number of years of education received (X₂), the number of years at the previous job (X₃), a dummy variable for marital status (X₄: 1 = married, 0 = otherwise), a dummy variable for head of household (X₅: 1 = yes, 0 = no) and a dummy variable for management position (X₆: 1 = yes, 0 = no).
The coefficient of multiple determination (R) for the regression model using each of the 6 variables Xⱼ as the dependent variable and all other X variables as independent variables are, respectively, 0.2628, 0.1240, 0.2404, 0.3510, 0.3342 and 0.0993.
The partial results from best-subset regression are given below:
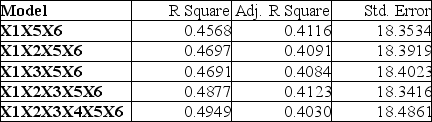
-Referring to Table 15-6, the model that includes X₁, X₂, X₅ and X₆ should be among the appropriate models using the Mallow's Cp statistic.
Definitions:
Positive Psychology
A branch of psychology focused on the study and promotion of positive aspects of human life, such as happiness, well-being, and personal strengths.
Human Strengths
The inherent potentials and positive qualities, such as resilience, courage, and empathy, that can be developed to enhance personal and collective well-being.
Virtues
Moral excellences or admirable qualities that guide behavior and actions, often seen as the foundation for ethical conduct.
Acquired Immune Deficiency Syndrome
A chronic, potentially life-threatening condition caused by the human immunodeficiency virus (HIV) that damages the immune system, impairing the body's ability to fight off organisms that cause disease.
Q16: When you use the Poisson distribution to
Q25: Referring to Table 17-2, what is the
Q35: Referring to Table 16-13, what is the
Q55: Referring to Table 15-2, is the overall
Q65: Referring to Table 17-7, an <img src="https://d2lvgg3v3hfg70.cloudfront.net/TB1602/.jpg"
Q80: The annual multiplicative time-series model does not
Q83: Referring to Table 17-9, an R chart
Q170: Referring to 14-16, what is the p-value
Q232: Referring to Table 14-13, the predicted demand
Q352: Referring to Table 14-3, the p-value for