TABLE 16-9
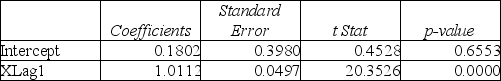
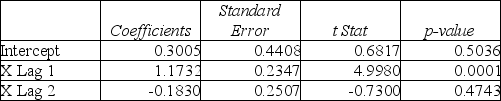
Given below are Excel outputs for various estimated autoregressive models for a company's real operating revenues (in billions of dollars) from 1985 to 2008. From the data, you also know that the real operating revenues for 2006, 2007, and 2008 are 11.7909, 11.7757 and 11.5537, respectively.
First-Order Autoregressive Model:
Second-Order Autoregressive Model:
Third-Order Autoregressive Model:
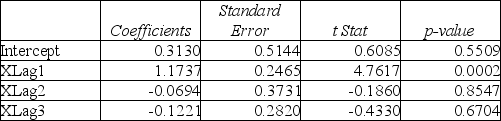
-Referring to Table 16-9, if one decides to use the Third-Order Autoregressive model, what will the predicted real operating revenue for the company be in 2011?
Definitions:
Q18: Referring to Table 15-1, what is the
Q23: Referring to Table 9-2, if you select
Q40: Referring to Table 17-3, suppose the analyst
Q75: Referring to Table 17-7, what is the
Q82: Referring to Table 16-4, exponential smoothing with
Q106: Referring to Table 17-6, the process seems
Q123: Referring to Table 16-3, if this series
Q126: Referring to Table 17-5, the process seems
Q161: Referring to Table 19-2, the coefficient of
Q300: Referring to Table 12-2, the decision made