TABLE 16-13
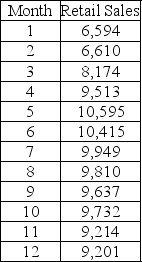
Given below is the monthly time-series data for U.S. retail sales of building materials over a specific year.

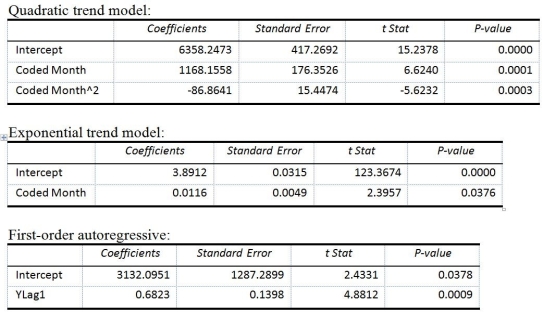
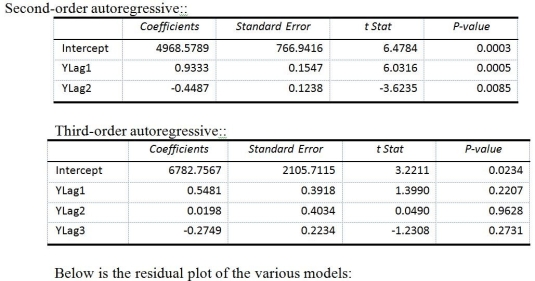
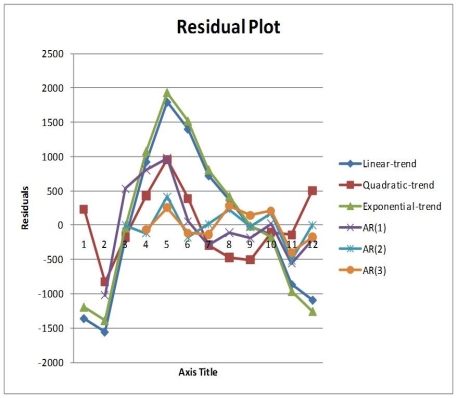
The results of the linear trend, quadratic trend, exponential trend, first-order autoregressive, second-order autoregressive and third-order autoregressive model are presented below in which the coded month for the first month is 0:


-Referring to Table 16-13, if a five-month moving average is used to smooth this series, what would be the last calculated value?
Definitions:
Critical Value
A threshold value used in hypothesis testing to determine whether to reject the null hypothesis.
Null Hypothesis
In hypothesis testing, it's the presumption that no significant difference exists as a result of the experiment or intervention.
Significance
The likelihood that a result from data collected and analyzed is not due to chance. It’s often determined through the use of a p-value.
Null Hypothesis
A hypothesis that there is no significant difference or effect in a particular situation, used as a starting point for statistical testing.
Q4: Data on the amount of money made
Q22: Referring to Table 16-12, the best interpretation
Q24: Referring to Table 17-5, the best estimate
Q47: One of the morals of the red
Q61: In multiple regression, the _ procedure permits
Q76: Referring to Table 17-8, an <img src="https://d2lvgg3v3hfg70.cloudfront.net/TB1602/.jpg"
Q86: Referring to Table 16-3, suppose the last
Q104: Referring to Table 7-2, 90% of the
Q186: Referring to 14-16, what is the p-value
Q203: Referring to Table 14-17 Model 1, which