TABLE 17-3
A quality control analyst for a light bulb manufacturer is concerned that the time it takes to produce a batch of light bulbs is too erratic. Accordingly, the analyst randomly surveys 10 production periods each day for 14 days and records the sample mean and range for each day.
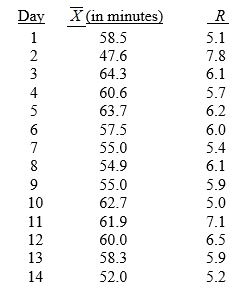
-Referring to Table 17-3, suppose the analyst constructs an R chart to see if the variability in production times is in-control. The R chart is characterized by which of the following?
Definitions:
Q13: Referring to Table 12-1, which pair(s) of
Q20: Referring to Table 14-17 Model 1, what
Q58: Referring to Table 16-9 and using a
Q89: An independent variable Xⱼ is considered highly
Q116: Referring to Table 16-12, the best interpretation
Q126: Referring to Table 16-12, the estimated quarterly
Q134: Referring to Table 16-5, the number of
Q169: Referring to Table 16-1, what are the
Q172: Referring to Table 19-5, what is the
Q279: Blossom's Flowers purchases roses for sale for