TABLE 17-7
A supplier of silicone sheets for producers of computer chips wants to evaluate her manufacturing process. She takes samples of size 5 from each day's output and counts the number of blemishes on each silicone sheet. The results from 20 days of such evaluations are presented below. 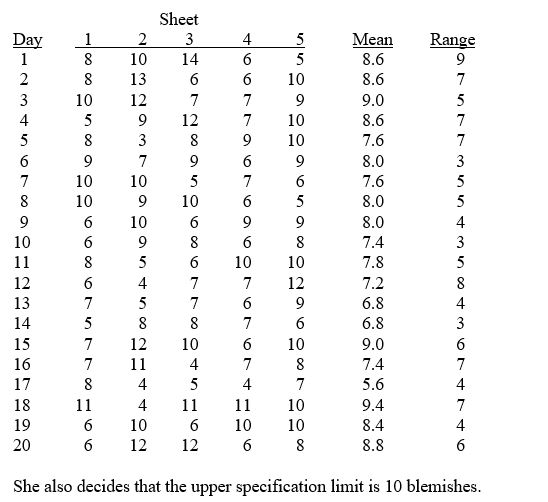
-Referring to Table 17-7, an R chart is to be constructed for the number of blemishes. The lower control limit for this data set is ________.
Definitions:
Normal Curve
A symmetrical bell-shaped curve that represents the distribution of many types of data where most values cluster around a mean.
Obtained Value
The score or number that results from a specific measurement or calculation.
Critical Value
A threshold in a hypothesis test that determines the boundary for rejecting the null hypothesis.
Type II Error
A statistical error that occurs when a false null hypothesis is not rejected, meaning a true effect or difference is missed.
Q7: The Paasche price index has the disadvantage
Q13: Referring to Table 12-1, which pair(s) of
Q27: The finite population correction factor is<br>A) <img
Q41: The Variance Inflationary Factor (VIF) measures the
Q55: The cause of variation that can be
Q78: Referring to Table 12-2, the null hypothesis
Q84: Referring to Table 15-2, given a quadratic
Q87: Referring to Table 14-19, there is not
Q127: Referring to Table 16-10, the fitted values
Q258: Referring to 14-16, which of the following