TABLE 12-2
An agronomist wants to compare the crop yield of 3 varieties of chickpea seeds. She plants all 3 varieties of the seeds on each of 5 different patches of fields. She then measures the crop yield in bushels per acre. Treating this as a randomized block design, the results are presented in the table that follows. 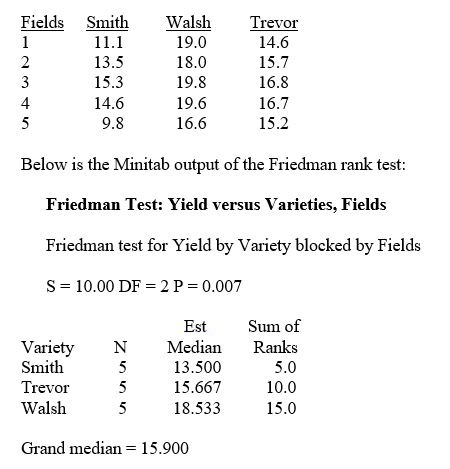
-Referring to Table 12-2, the null hypothesis for the Friedman rank test is
Definitions:
Annual Demand
Annual demand quantifies the total quantity of a particular product or service that consumers are willing to buy over the course of a year.
Price Breaks
Discounts or lower pricing offered by suppliers to buyers as incentives for purchasing larger quantities.
Safety Stock
A quantity of inventory maintained to guard against shortages or delays in supply or demand, acting as a buffer.
Stockouts
Situations where demand cannot be fulfilled because the inventory of a product is exhausted, often resulting in lost sales or customer dissatisfaction.
Q6: Referring to Table 17-7, an R chart
Q23: A survey claims that 9 out of
Q23: Referring to Table 9-2, if you select
Q25: Referring to Table 17-2, what is the
Q36: The terms strategic management and strategic planning
Q39: Data on the amount of money made
Q82: A tabular presentation that shows the outcome
Q122: Referring to Table 16-8, the fitted value
Q128: Cp > 1 indicates that if the
Q294: Referring to Table 19-5, what is the