Below is a contour diagram depicting D, the average fox population density as a function of  , kilometers east of the western end of England, and
  , kilometers north of the same point.
 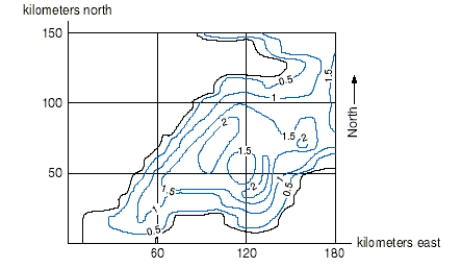 Is D increasing or decreasing at the point (120, 25) in the northern direction?
Definitions:
Net Income
The profit of a company after all expenses, taxes, and costs have been subtracted from total revenue.
Internal Growth Rate
The maximum growth rate a firm can achieve without resorting to external financing.
Sustainable Growth Rate
The maximum rate at which a company can grow its sales, earnings, and dividends without increasing its financial leverage.
Debt to Equity Ratio
The ratio showing the variance in financing methods between debt and equity for a company’s assets.
Q1: Ike, an investor, is considering opening a
Q3: Find a and b so that <img
Q15: A ball is dropped from a height
Q16: The owner of a jewelry store has
Q29: The production function for a company is
Q41: The solution to the differential equation <img
Q45: If <img src="https://d2lvgg3v3hfg70.cloudfront.net/TB8190/.jpg" alt="If ,
Q61: The heat index tells you how hot
Q97: What is the solution of <img src="https://d2lvgg3v3hfg70.cloudfront.net/TB8190/.jpg"
Q114: Find the first derivative of <img src="https://d2lvgg3v3hfg70.cloudfront.net/TB8190/.jpg"