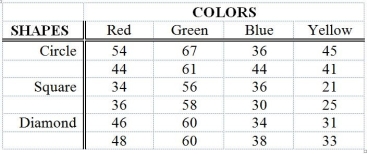
TABLE 11-12
The marketing manager of a company producing a new cereal aimed for children wants to examine the effect of the color and shape of the box's logo on the approval rating of the cereal. He combined 4 colors and 3 shapes to produce a total of 12 designs. Each logo was presented to 2 different groups (a total of 24 groups) and the approval rating for each was recorded and is shown below. The manager analyzed these data using the α = 0.05 level of significance for all inferences.

Analysis of Variance
Source df SS MS F p
Colors 3 2711.17 903.72 72.30 0.000
Shapes 2 579.00 289.50 23.16 0.000
Interaction 6 150.33 25.06 2.00 0.144
Error 12 150.00 12.50
Total 23 3590.50
-Referring to Table 11-12, the mean square for error is ________.
Definitions:
Average Variable Cost
The total variable costs of production divided by the number of units produced, representing the variable cost per unit.
Instructional Modules
Structured units of teaching material or academic content designed for educational purposes.
Variable Cost
Costs that change in proportion to the level of production or business activity.
Average Total Cost
The total cost divided by the number of goods produced, representing the cost per unit of output.
Q7: Referring to Table 12-11,the same decision would
Q40: Referring to Table 14-1,for these data,what is
Q49: Assuming a linear relationship between X and
Q108: In instances in which there is insufficient
Q112: Referring to Table 10-12,the hypotheses that should
Q117: The Regression Sum of Squares (SSR)can never
Q125: Referring to Table 10-5,at the 0.05 level
Q149: The confidence interval for the mean of
Q157: Referring to Table 11-5,the among-group variation or
Q172: Referring to Table 12-16,there is sufficient evidence