TABLE 13-11
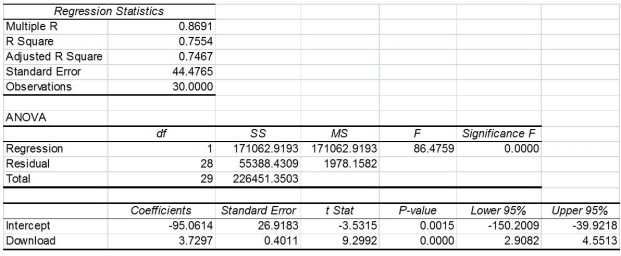
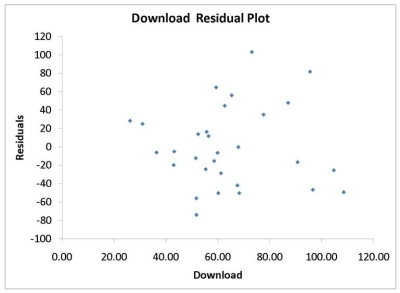
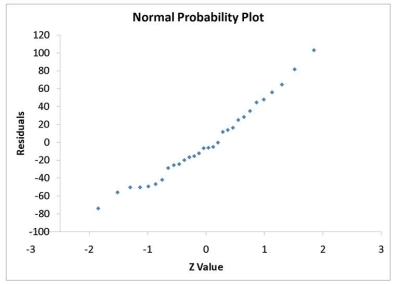
A computer software developer would like to use the number of downloads (in thousands) for the trial version of his new shareware to predict the amount of revenue (in thousands of dollars) he can make on the full version of the new shareware. Following is the output from a simple linear regression along with the residual plot and normal probability plot obtained from a data set of 30 different sharewares that he has developed:


-Referring to Table 13-11, which of the following assumptions appears to have been violated?
Definitions:
Degrees of Freedom
In statistics, the number of independent values or quantities that can be assigned to a statistical distribution.
Distribution Table
A table that displays the frequency of various outcomes in a sample, often used in statistics to organize data.
Rule of Five
A statistical rule stating that if a sample size is very small (n=5), the median can serve as an estimate of the population mean under certain conditions.
Observed Frequency
The observed frequency is the actual number of times an event occurs in a dataset or experiment.
Q1: Referring to Table 13-3,the director of cooperative
Q28: Referring to Table 15-6,the model that includes
Q80: Referring to Table 13-10,the null hypothesis for
Q98: Referring to Table 11-11,what was the total
Q118: Referring to Table 12-3,the expected cell frequency
Q152: Referring to Table 12-16,the decision is to
Q178: Referring to Table 12-5,the expected cell frequency
Q178: An agronomist wants to compare the crop
Q185: Referring to Table 14-17 Model 1,the null
Q299: Referring to 14-16,the 0 to 60 miles