TABLE 14-3
An economist is interested to see how consumption for an economy (in $ billions) is influenced by gross domestic product ($ billions) and aggregate price (consumer price index) . The Microsoft Excel output of this regression is partially reproduced below. 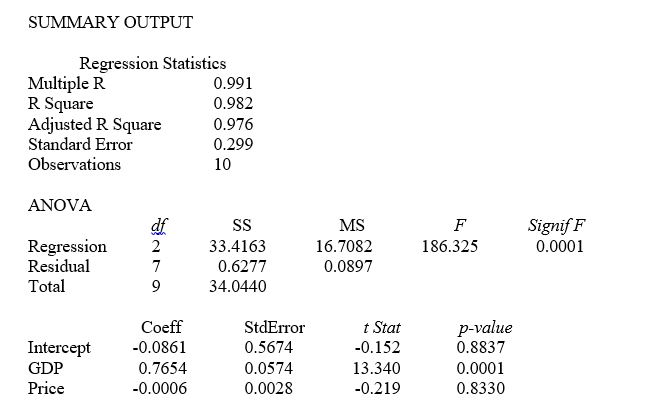
-Referring to Table 14-3, to test for the significance of the coefficient on aggregate price index, the p-value is
Definitions:
Unbiasedness
A statistical property indicating that an estimator or methodology does not systematically favor certain outcomes over others.
Sample Variance
The measure of variability in a sample dataset, calculated as the sum of squared deviations from the mean, divided by the number of observations minus one.
Population Variance
A measure of how data points in a given population are dispersed from the average value.
Unbiased Estimator
A statistical estimator whose expected value is equal to the true parameter of the population being studied.
Q5: Referring to Table 12-3,the expected cell frequency
Q26: Referring to Table 13-10,what is the value
Q42: Referring to Table 14-17 Model 1,_ of
Q55: The Journal of Business Venturing reported on
Q72: Referring to Table 13-7,to test whether the
Q95: Referring to Table 13-13,what percentage of the
Q115: Referring to Table 13-4,the standard error of
Q189: Referring to Table 13-3,suppose the director of
Q247: Referring to 14-16,what is the value of
Q278: Referring to Table 14-15,what is the standard