TABLE 14-8
A financial analyst wanted to examine the relationship between salary (in $1,000) and 4 variables: age (X₁ = Age), experience in the field (X₂ = Exper), number of degrees (X₃ = Degrees), and number of previous jobs in the field (X₄ = Prevjobs). He took a sample of 20 employees and obtained the following Microsoft Excel output: 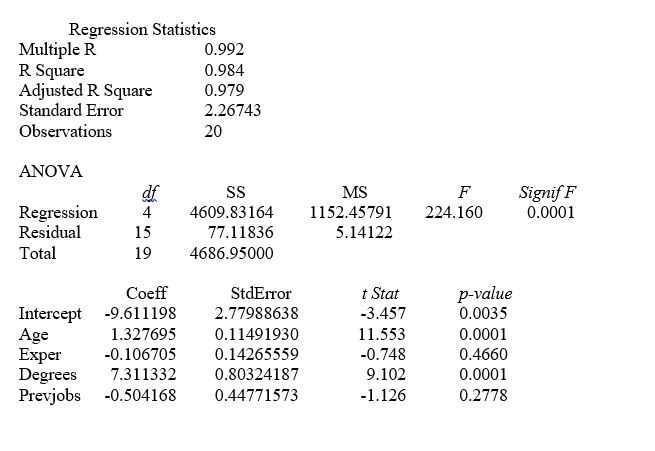
-Referring to Table 14-8, the value of the F-statistic for testing the significance of the entire regression is ________.
Definitions:
Mode
The value that appears most frequently in a data set.
English Exam
A formal test assessing an individual's mastery and understanding of the English language, covering aspects such as grammar, vocabulary, reading comprehension, and writing skills.
Descriptive Statistics
Statistical methods that summarize and organize the characteristics of a set of data, including measures of central tendency and variability.
Inferential Statistics
A branch of statistics that allows us to make predictions or inferences about a population based on data collected from a sample.
Q15: Referring to Table 13-12,there is no evidence
Q23: Referring to Table 14-19,what is the estimated
Q28: Referring to Table 14-3,when the economist used
Q29: Referring to Table 15-4,what is the p-value
Q31: Referring to Table 14-3,to test whether aggregate
Q35: Referring to Table 15-6,what is the value
Q98: Referring to Table 12-19,the sporting goods retailer
Q100: Referring to Table 16-13,what is your forecast
Q111: Referring to Table 12-16,the p-value of the
Q315: Referring to Table 14-17 Model 1,the null