TABLE 15-1
A certain type of rare gem serves as a status symbol for many of its owners. In theory, for low prices, the demand increases and it decreases as the price of the gem increases. However, experts hypothesize that when the gem is valued at very high prices, the demand increases with price due to the status owners believe they gain in obtaining the gem. Thus, the model proposed to best explain the demand for the gem by its price is the quadratic model:
Y = β₀ + β₁X + β₁X² + ε
where Y = demand (in thousands) and X = retail price per carat.
This model was fit to data collected for a sample of 12 rare gems of this type. A portion of the computer analysis obtained from Microsoft Excel is shown below: 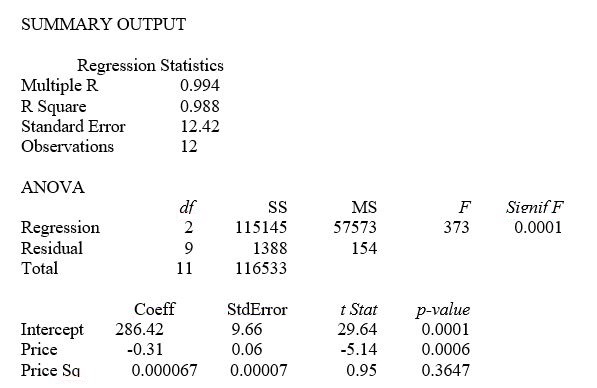
-Referring to Table 15-1, what is the value of the test statistic for testing whether there is an upward curvature in the response curve relating the demand (Y) and the price (X) ?
Definitions:
Price Level
A gauge of the mean prices for goods and services in an economy during a certain period.
Unemployment Rate
The unemployment rate is a measure expressed as a percentage, showing the portion of the labor force that is jobless and actively seeking employment, reflecting the health of an economy's labor market.
Natural Rate
An economic concept referring to the level of any specific economic variable that is achieved in the long run and is unimpacted by short-term fluctuations.
Historical Analysis
The examination of past events to understand their causes, effects, and implications for the present and future.
Q30: Referring to Table 14-18,what should be the
Q37: Referring to Table 17-10,based on the c
Q84: Referring to Table 14-15,the alternative hypothesis H₁:
Q91: Based on past experience,only 0.5% of the
Q113: A zero population correlation coefficient between a
Q115: Referring to Table 16-1,set up a scatter
Q163: Referring to Table 16-4,a centered 5-year moving
Q182: Referring to Table 14-2,an employee who took
Q240: Referring to Table 7-1,80% of all the
Q303: Referring to Table 14-19,what should be the